- Clinical Technology
- Adult Immunization
- Hepatology
- Pediatric Immunization
- Screening
- Psychiatry
- Allergy
- Women's Health
- Cardiology
- Pediatrics
- Dermatology
- Endocrinology
- Pain Management
- Gastroenterology
- Infectious Disease
- Obesity Medicine
- Rheumatology
- Nephrology
- Neurology
- Pulmonology
US Prescription Sales Growth Slows
Prescription drug sales in the United States grew at a modest 3.8% rate in 2007 (Cover Figure), to total $286.5 billion, according to an annual IMS Health report, US Pharmaceutical Market Performance Review, based on findings of the IMS National Sales Perspectives and the IMS National Prescription Audit. This compares with a growth rate of 8.3% for 2006. Slower sales growth was attributed by IMS Health to brand-name patent expirations, fewer new products approved, and drug safety issues.
Prescription drug sales in the United States grew at a modest 3.8% rate in 2007 (Cover Figure), to total $286.5 billion, according to an annual IMS Health report, US Pharmaceutical Market Performance Review, based on findings of the IMS National Sales Perspectives and the IMS National Prescription Audit. This compares with a growth rate of 8.3% for 2006. Slower sales growth was attributed by IMS Health to brand-name patent expirations, fewer new products approved, and drug safety issues.
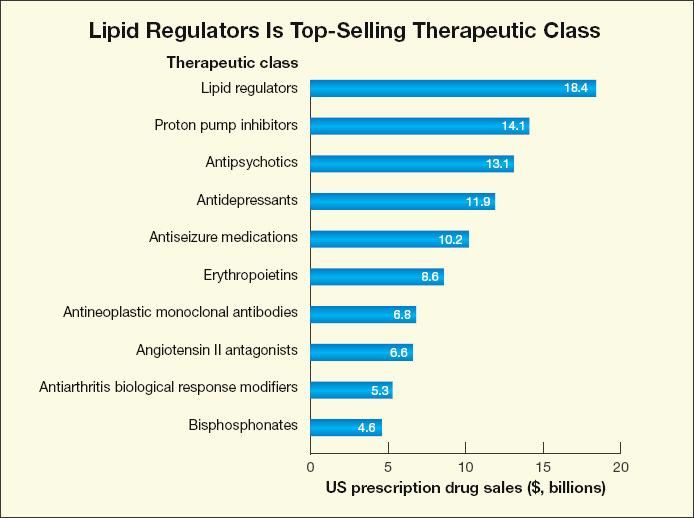
With prescription sales totaling $18.4 billion, the therapeutic category of lipid regulators continues to be the largest in sales despite a sales decline of 15.4% from 2006 (Figure 1). Proton pump inhibitors was second with prescription sales of $14.1 billion and a growth rate of 2.8%. Antipsychotics replaced antidepressants as the third largest therapeutic class in 2007, with prescription sales growth of 12.1% to $13.1 billion.

Figure 1. Sales of both lipid regulators and antidepressants declined in 2007
because of greater use of generics; sales of erythropoietins also declined because of safety concerns.
Sales of antipsychotics showed the most growth over 2006.
Source: IMS Health, IMS National Sales Perspectives.
The leading products by US 2007 sales are Lipitor ($8.1 billion, down from $8.7 billion in 2006), Nexium ($5.5 billion, up from $5.2 billion), Advair Diskus ($4.3 billion, up from $4 billion), Plavix ($3.9 billion, up from $3 billion), Seroquel ($3.5 billion, up from $3 billion), Singulair ($3.4 billion, up from $3 billion), Enbrel ($3.4 billion, up from $3.1 billion), Prevacid ($3.4 billion, down from $3.6 billion), Aranesp ($3.2 billion, down from $4 billion), and Epogen ($3.1 billion, down from $3.2 billion).
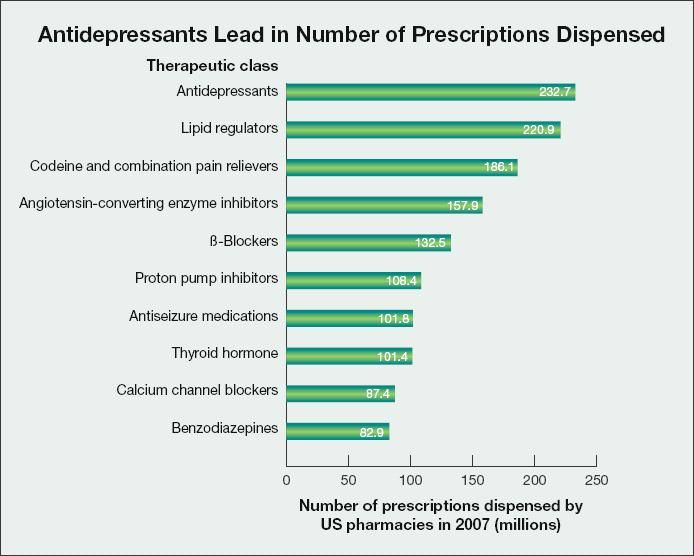
The volume of prescriptions dispensed grew 2.8% in 2007 to total 3.8 billion, down from a 4.6% growth rate in 2006. Antidepressants led among therapeutic classes with the most prescriptions dispensed. Rounding out the top 5 categories were lipid regulators, narcotic pain medications, angiotensin-converting enzyme inhibitors, and β-blockers (Figure 2).

Figure 2. Antidepressants continue to lead with the most prescriptions dispensed since 2003,
although the number of prescriptions for lipid regulators is growing faster, narrowing the gap.
Source: IMS Health, IMS National Prescription Audit.
The top 10 products by number of US prescriptions dispensed in 2007, including just 1 brand-name drug, are hydrocodone/acetaminophen (119.1 million), lisinopril (70.5 million), Lipitor (65.1 million), levothyroxine (55.3 million), amoxicillin (53.2 million), hydrochlorothiazide (47.8 million), simvastatin (47.7 million), azithromycin (46.3 million), atenolol (44.2 million), and furosemide (43.8 million).
"In 2007, the US pharmaceutical market experienced its lowest growth rate since 1961," said Murray Aitken, senior vice president, Healthcare Insight, at IMS Health. "The moderating growth trend that began in 2001 resumed in 2007 following the onetime impact on market growth in 2006 from implementation of Medicare Part D. Last year we saw a continuing shift away from primary care classes to biotech, which grew at 9%, and specialist-driven therapies, which grew at 10%. Oncology drugs grew at 14% as a result of innovative new medicines, expanded indications, and accelerated uptake of products to fill unmet needs."
Brand-name drugs representing $17 billion in sales lost exclusivity in 2007, fueling prescription volume growth of 10% for unbranded generics. Uptake of new, innovative medications represented just $441 million of total sales of $286.5 billion, reflecting both the fewest new product launches in the past 3 decades and slower acceptance by physicians of these new products.
In 2008, IMS expects that the introduction of novel biologics and vaccines and the launch of 5 to 8 new products with potential blockbuster status will help offset the impact of lower generic pricing. An additional $13 billion in brand-name products are likely to face generic competition this year.
IMS forecasts sales growth of 3% to 6% annually through 2012. Trends expected to shape the market over the next 5 years include continued loss of market exclusivity in major therapy areas, new specialist-driven products, increased therapeutic substitution, and greater awareness and focus on safety issues.
"The US pharmaceutical market has entered a new era-one characterized by more modest growth due to the continuing impact of new generic products, fewer and more narrowly indicated novel indications, and closer scrutiny of safety issues," said Aiken. "We will see additional lower-cost treatment options for many patients while new and innovative therapies are delivered to specific patient groups, such as those suffering with cancer. Safety issues will be closely monitored and are likely to bring added caution to the market over the next several years."
