- Clinical Technology
- Adult Immunization
- Hepatology
- Pediatric Immunization
- Screening
- Psychiatry
- Allergy
- Women's Health
- Cardiology
- Pediatrics
- Dermatology
- Endocrinology
- Pain Management
- Gastroenterology
- Infectious Disease
- Obesity Medicine
- Rheumatology
- Nephrology
- Neurology
- Pulmonology
Middle-Aged Man With Light-Headedness, Nausea, and Palpitations
A 44-year-old man presents to the emergency department (ED) with light-headedness, nausea, and vomiting of 1 day's duration. He has also had intermittent palpitations but denies chest pain, dyspnea, and weakness.

A 44-year-old man presents to the emergency department (ED) with light-headedness, nausea, and vomiting of 1 day's duration. He has also had intermittent palpitations but denies chest pain, dyspnea, and weakness. He also denies previous cardiac disease, cardiac risk factors, and a family history of heart disease. However, 6 months earlier he experienced an episode of syncope while walking; he did not seek medical attention for it.
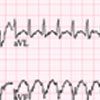
His temperature is 36.2ºC (98.2ºF); heart rate, 225 beats per minute; respiration rate, 20 breaths per minute; and blood pressure, 96/49 mm Hg. Head, ears, eyes, nose, and throat are normal, and there is no evidence of jugular venous distention. His chest is clear symmetrically, and auscultation reveals a regular tachycardia with no gallops, rubs, or murmurs. Abdominal findings are normal, and his extremities show no cyanosis or edema. Because of the patient's nonspecific complaints and tachycardic pulse, an ECG is obtained (Figure 1).
Which of the following diagnoses is best supported by the ECG and clinical findings?
• Sinus tachycardia.
• Supraventricular tachycardia with aberrancy.
• Ventricular tachycardia or flutter.
• Atrial fibrillation.
• Atrioventricular (AV) nodal reentry tachycardia without aberrancy.
(Answer and discussion on next page.)
Answer: Supraventricular tachycardia with aberrancy
WHAT THE ECG SHOWS
The initial 12-lead ECG (Figure 1) demonstrates a remarkable tachycardia (rate, 225 beats per minute). After determining the rate of any rhythm, its regularity should be evaluated. The rhythm here appears very regular. This finding makes causes of an irregular tachycardia, such as atrial fibrillation-or other atrial tachycardia with variable atrioventricular block-much less likely. In fact, atrial fibrillation classically presents as an irregularly irregular rhythm.
The width of the QRS complex also provides important clues to the cause of tachycardia. A narrow QRS complex (less than 0.12 seconds) indicates that the normal electrical activation pathways of the ventricles are intact. A wide QRS complex (more than 0.12 seconds) indicates either an aberrant conduction pathway for ventricular activation or activation of ventricular origin.
In this patient, the QRS complex is wide, at approximately 0.18 seconds. This finding makes sinus tachycardia and AV nodal reentry tachycardia without aberrancy much less likely. The very rapid rate also militates against typical sinus tachycardia.
DISTINGUISHING BETWEEN CAUSES OF REGULAR, WIDE QRS–COMPLEX TACHYCARDIA
Ventricular tachycardia (VT) is seen when ventricular activation occurs from an ectopic focus in the ventricle. VT is a common cause of regular, wide-complex QRS tachycardia1 and is frequently a complication of coronary artery disease, active ischemia, or chronic scar tissue.2

Figure 1

Figure 2
Figure 1 – The patient's initial ECG shows a regular, wide
QRS–complex tachycardic rhythm (rate, 225 beats per minute).
The findings of rSR' in lead V1 and the tall R wave and wide S
wave in lead V6 suggest that the cause is supraventricular
tachycardia with aberrancy.
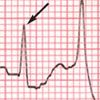
Figure 2 –This ECG in another patient shows ventricular
tachycardia with capture beat (arrow).
Ventricular flutter is a type of ventricular tachycardia in which the ECG shows a continuous sine wave with no clear QRS complexes or ST-T waves.
Differentiating VT from supraventricular tachycardia (SVT) with aberrancy is often quite difficult. Yet, because of its potential for acute morbidity, identifying VT can be critically important. There are few ECG findings other than capture beats (narrow complex beats that result from a supraventricular impulse successfully conducted to the ventricles) (Figure 2) or fusion beats (caused by partial capture of the supraventricular impulse fused with an ectopic ventricular beat) that reliably confirm the diagnosis of VT. The presence of AV dissociation (characterized by P waves that are discernible at a fixed P-P interval at a rate less than that of the tachycardic wide-complex rhythm [the VT] and without apparent relationship to the QRS complexes) also confirms VT as the cause of a wide QRS-complex rhythm. None of these findings are seen here.
Although making a definitive diagnosis of VT can be problematic, a number of ECG findings serve as good clues. Typically, the ventricular rate in VT is between 140 and 200 beats per minute, and often the width of the QRS complexes is much greater than that seen in SVT with aberrancy. However, these findings only suggest the diagnosis and are not definitive.
The morphology of the QRS complex configuration can also help identify VT. Concordance of the precordial leads can be highly suggestive of VT (either negative concordance, in which leads V1 through V6 are all negative, or positive concordance, in which leads V1 through V6 are all positive). Additional clues can be gleaned from the morphology of individual QRS complexes; particularly that of lead V1. When lead V1 is positive and the rhythm is VT (as occurs in a left-sided focus, or so-called right bundle-branch block-type VT), the initial R peak is usually taller than the later r9 peak (RSr9- the "reversed rabbit ears" pattern).3

Figure 3

Figure 4
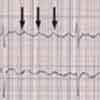
Figure 3 –This ECG rhythm strip was obtained in the same
patient whose initial ECG is shown in Figure 1, but this strip
followed performance of a Valsalva manuever and administration
of adenosine. The arrows highlight a sawtooth P-wave pattern
consistent with atrial flutter.
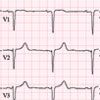
Figure 4 – A subsequent ECG obtained in the same patient as
those in Figures 1 and 3 shows conversion to sinus rhythm. Note
the disappearance of the right bundle-branch morphology, which
had resulted from aberrant conduction.
On this patient's ECG, V1 is positive but the later R9 peak is taller than the initial r peak (rSR9). In addition, in V1-positive VT, the R:S ratio in lead V6 is usually less than 1; this does not appear to be the case here. Instead, the rSR9 pattern in lead V1 and the tall R wave and wide S wave in lead V6 suggest SVT with aberrancy. Ventricular flutter is excluded by the clear distinction between QRS complexes, ST segments, and T waves.
OUTCOME OF THIS CASE
In the ED, the patient was asked to perform a Valsalva maneuver and was given 2 doses of adenosine (6 and 12 mg) to slow impulse conduction through the AV node; these steps revealed the underlying rhythm. The ECG rhythm strip obtained after these 2 maneuvers showed evidence of a sawtooth pattern consistent with atrial flutter (Figure 3). The patient was subsequently admitted to the cardiology service.
During his hospitalization, he spontaneously converted from atrial flutter to sinus rhythm (Figure 4). Acute myocardial infarction was ruled out, and cardiac catheterization revealed only mild atherosclerosis. Although the study did show some evidence of left ventricular dysfunction, subsequent outpatient Holter monitoring revealed only sinus rhythm with occasional premature atrial contractions. The patient was referred to the outpatient electrophysiology service for further management.
References:
REFERENCES:
1.
Gupta AK, Thakur RK. Wide QRS complex tachycardias.
Med Clin North Am
. 2001;85:245.
2.
Jensen S, Stahmer SA. Ventricular tachycardia and ventricular fibrillation. In: Chan TC, Brady WJ, Harrigan RA, et al.
ECG in Emergency Medicine and Acute
Care.
Philadelphia: Elsevier Mosby; 2005:118-127.
3.
Mattu A, Brady WJ, Perron AD, et al. Prominent R wave in lead V
1
: electrocardiographic differential diagnosis.
Am J Emerg Med
. 2001;19:504.
