- Clinical Technology
- Adult Immunization
- Hepatology
- Pediatric Immunization
- Screening
- Psychiatry
- Allergy
- Women's Health
- Cardiology
- Pediatrics
- Dermatology
- Endocrinology
- Pain Management
- Gastroenterology
- Infectious Disease
- Obesity Medicine
- Rheumatology
- Nephrology
- Neurology
- Pulmonology
LAD Occlusion Signaled by Ominous ECG
The ECG is frequently the initial diagnostic tool used by clinicians when evaluating patients with suspected acute coronary syndrome.
Figure 1. NSR with prominent T waves and normal ST segments in the precordial leads.

Figure 2. ST segment depression with upsloping ST segments continuing into tall, prominent, symmetrical T waves in the precordial leads in leads V2 to V4. ST segment elevation is seen in lead aVr.

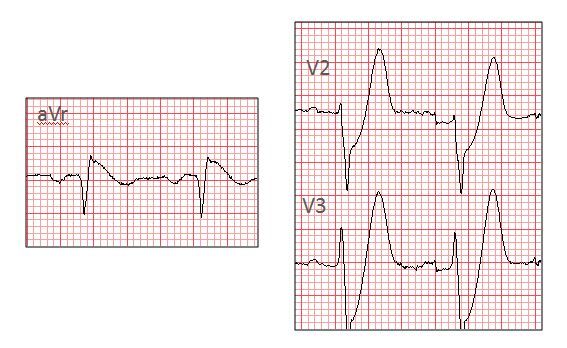
Figure 3. In lead aVr, ST segment elevation is noted. In leads V2 and V3, prominent T waves, with depression of the ST segment, are seen.

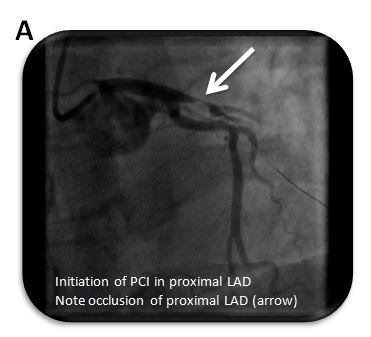
Figure 4a. Proximal LAD artery occlusion (arrow).

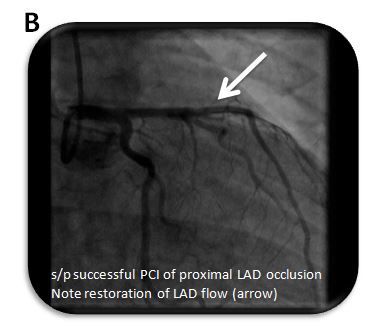
Figure 4b. After PCI, coronary flow (arrow) has been restored in the LAD artery.

A 47-year-old man with no previous medical history called 911 complaining of chest pain; EMS treated the patient with aspirin and sublingual nitrates and obtained an ECG (Figure1) at 9:50 am. He was transported emergently to the emergency department (ED) with chest pain described as an aching sensation. The pain was associated with nausea, dyspnea, and diaphoresis and had begun intermittently approximately 5 hours before the 911 call that morning. On ED arrival, the patient was ill-appearing with significant diaphoresis. The examination was otherwise unremarkable. An ECG (Figure 2) was obtained at 10:03 am while management continued.
The high-risk findings noted on the ECG in Figure 2 include which of the following:
A. ST-segment elevation in lead aVr.
B. Prominent T waves in the right to mid-precordial leads.
C. ST-segment depression in the right to mid-precordial leads.
D. All of the above.
Answer: D. All of the above.
Discussion
The ECG is frequently the initial diagnostic tool used by clinicians when evaluating patients with suspected acute coronary syndrome (ACS). Certain ACS ECG patterns, which do not include widespread ST-segment elevation, are indicative of significant arterial occlusion in the ACS patient; these patterns are, of course, associated with significant risk to the patient and mandate a rapid response. Many of these high-risk ECG patterns are well described and recognized-while others are not. One such high-risk ECG pattern, recently described,1,2 includes the association of the prominent T wave and J point depression producing ST-segment depression seen in the precordial leads, coupled with ST-segment elevation in lead aVr (Figure 1).1,2
This ECG pattern is defined as follows: (1) ST-segment depression with upsloping ST segments continuing into tall, prominent, symmetrical T waves in the precordial leads (Figures 2 and 3); (2) ST-segment elevation in lead aVr (Figures 2 and 3); and (3) the absence of ST-segment elevation in the affected leads.1,2 The current literature1,2 suggests that this pattern by itself is a high-risk, ECG presentation. This ECG constellation of findings is associated with significant proximal left anterior descending artery (LAD) occlusion (Figure 4) and ultimately anterior wall STEMI. In fact, recent publications have suggested that this ECG pattern should be treated as a STEMI equivalent presentation based on angiographic evidence. 3-6
Case Conclusion
The initial ED ECG (Figure 2) demonstrated prominent T waves with J point depression in the anterior leads as well as ST-segment elevation in lead aVr. The ECG findings were recognized with urgent cardiology consultation. The patient was taken to the cardiac catheterization laboratory where percutaneous coronary intervention was performed (Figure 4). A proximal LAD occlusion was noted and successfully treated with restoration of flow. The patient did well during the reminder of the hospital course and was discharged uneventfully on hospital day 3.
References:
- de Winter R, Verouden N, Wellens H, Wilde A. A new ECG sign of proximal LAD occlusion. N Engl J Med. 2008;359:2071-2073.
- Verouden NJ, Koch KT, Peters RJ, et al. Persistent precordial “hyperacute” T-waves signify proximal left anterior descending artery occlusion. Heart. 2009;95:1701-1706.
- Zhong-qun Z, Nikus KC, Sclarovsky S. Prominent precordial T waves as a sign of acute anterior myocardial infarction: electrocardiographic and angiographic correlations. J Electrocardiol. 2011;44:533-537.
- Fesmire F, Hennings J. A new electrocardiographic criteria for emergent reperfusion therapy. Am J Emerg Med. 2012;30:994-1000.
- Birnbaum Y, Bayes de Luna A, Fiol M, et al. Common pitfalls in the interpretation of electrocardiograms from patients with acute coronary syndromes with narrow QRS: a consensus report. J Electrocardiol. 2012;45:463-475.
- Lawner BJ, Nable JV, Mattu A. Novel patterns of ischemia and STEMI equivalents. Cardiol Clin. 2012;30:591-599.
