- Clinical Technology
- Adult Immunization
- Hepatology
- Pediatric Immunization
- Screening
- Psychiatry
- Allergy
- Women's Health
- Cardiology
- Pediatrics
- Dermatology
- Endocrinology
- Pain Management
- Gastroenterology
- Infectious Disease
- Obesity Medicine
- Rheumatology
- Nephrology
- Neurology
- Pulmonology
ECG Challenge: Nausea and Weakness in a Woman With Multiple Diseases
A 60-year-old woman with hypertension, diabetes mellitus, and intermittentatrial fibrillation presents with nausea, diaphoresis, dizziness, and globalweakness that has lasted 1 hour. She denies chest pain, dyspnea, syncope,vomiting, diarrhea, blood loss, and headache; there is no vertigo. Medicationsinclude acetaminophen, digoxin, diltiazem, glipizide, hydrochlorothiazide,irbesartan, metformin, pioglitazone, and warfarin.

A 60-year-old woman with hypertension, diabetes mellitus, and intermittentatrial fibrillation presents with nausea, diaphoresis, dizziness, and globalweakness that has lasted 1 hour. She denies chest pain, dyspnea, syncope,vomiting, diarrhea, blood loss, and headache; there is no vertigo. Medicationsinclude acetaminophen, digoxin, diltiazem, glipizide, hydrochlorothiazide,irbesartan, metformin, pioglitazone, and warfarin.
Vital signs are normal. The patient is mildly nauseated but otherwise inno acute distress. The skin is dry, the lungs are clear, and the heartbeat is regular,without abnormal sounds. Palpation of the abdomen reveals diffuse mildtenderness without guarding or signs of peritoneal problems. There is symmetrictrace pitting edema in the pretibial area. Results of a neurologic examinationare normal except for an unsteady gait; however, there is no true ataxia.
Venous access is secured, and a 12-lead ECG is obtained. Meanwhile, afingerstick glucose test shows a level of 43 mg/dL, which suggests that the patient'ssymptoms are the result of a hypoglycemic episode. Her symptoms resolveafter supplemental glucose is administered, but the findings on a secondECG remain unchanged.
Which of the following best explains the ECG findings?
A. Acute coronary syndrome.
B. Left ventricular hypertrophy with repolarization abnormality.
C. Left bundle-branch block.
D. Digitalis effect.
E. Hypokalemia secondary to the thiazide diuretic.
F. Hypercalcemia secondary to the thiazide diuretic.

Figure 1

Figure 2
DISCUSSION
The ECG abnormalities--althoughthey are likely unrelated tothe patient's recent symptoms--warranta closer look to determine thecause of these persisting changes.
The ECG demonstrates normalsinus rhythm with a first-degree atrioventricularblock (Figure 1). The QRSaxis and width are normal, but the QTinterval appears somewhat short. Themost striking findings are seen in theST segments, where there are convexelevations in leads V.1 through V3, andconcave depressions in leads I, aVL,V5, V6, and the inferior leads (II, III,and aVF). The T waves are difficult tolocate in some leads; they seem tobe merged with the ST segment in virtuallyall leads except V4 and V,5.
Focusing on the ST-segmentchanges can help in sorting throughthe many potential causes of this patient'sECG abnormalities (Table).In keeping with the "worst first" doctrine,myocardial ischemia must beconsidered initially.
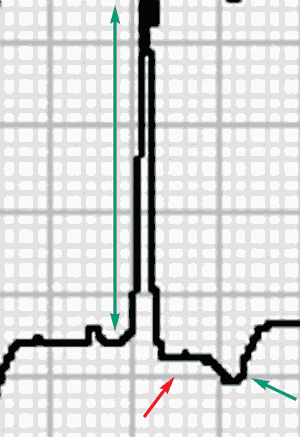
Ischemic syndromes. PrimaryST-segment depression of acute coronarysyndrome (A) may include findings that are localized or rather diffuse(Figure 2).1 ST-segment depressionin acute coronary syndromeis classically horizontal or downwardsloping,whereas the contour of thedepressed ST segments in this tracingis neither horizontal nor downward-sloping but concave. Obtainingserial tracings (coronary ischemiais a dynamic phenomenon) andchecking serum markers for cardiacischemia (eg, troponins) could providehelpful adjunctive information inan evaluation for acute coronarysyndrome.

Figure 3

Figure 4
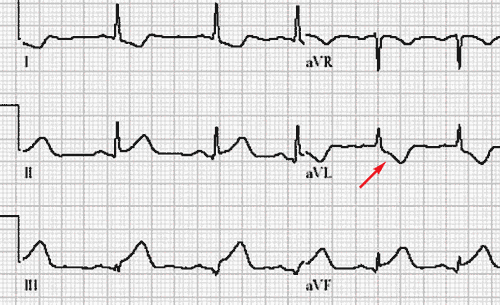
Two other related phenomenathat cause ST-segment depressionare important to consider. Reciprocalchange is the ST-segment depressionthat occurs in the lead or leads withan ECG vector approaching 180 degreesopposite that of the leads thatdemonstrate ST-segment elevation ofacute myocardial infarction (STEMI).Reciprocal change caused by an inferiorSTEMI classically occurs in leadaVL (Figure 3) but also can be seenin lead I or the anterior leads. Reciprocalchanges are more commonwith inferior STEMI than with anteriorSTEMI (where the reciprocalchanges may occur inferiorly). Theyalso reflect more extensive disease inthe former setting--carrying a worseprognosis but a better benefit fromrevascularization.2,3
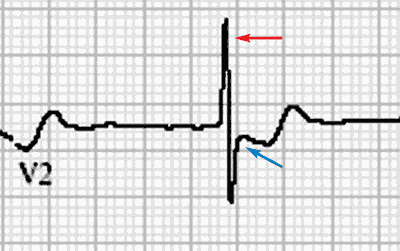
Posterior acute MI may also produceST-segment depression in theright precordial leads (Figure 4).Typically seen in association with inferioror inferolateral STEMI, posterioracute MI usually features STsegmentdepression with tall uprightT waves in the right precordial leads(V1, V2, V3), as well as R-wave amplitudethat exceeds S-wave amplitudein lead V2. These changes are, in effect,the mirror image of changes thatcan be recorded in posterior leads V8and V9--ST-segment elevation withT-wave inversion and Q waves--should they be used.4
Nonischemic syndromes. STsegmentdepression is also seen inother conditions. Ventricular hypertrophycan be accompanied by repolarization,or strain abnormalities. Inthe more common left ventricular hypertrophy(LVH) (B), ST-segmentdepression occurs in the lateralleads--because these (I, aVL, V5, andV6) are the ones in which LVH producesthe most prominent R waves(Figure 5). Characteristically, theECG of a patient with LVH withstrain features downward-sloping STsegmentdepression that ends in anasymmetrically inverted T wave. TheT wave has a gradual initial descent,followed by a steeper, upward-slopingterminal limb that may overshoot thebaseline. Unlike the ST-segment depressionof an acute coronary syndrome,the ST-segment/T-wavechanges of ventricular hypertrophyshould remain stable over time.1Tracings from the right precordialleads in LVH with strain may showthe mirror image--ST-segment elevationwith asymmetric prominentupright T waves--of the changesseen in the left-sided leads describedabove. This tracing does have thisright-side/left-side mirror symmetry(see Figure 1); however, the contourof the ST-segment changes is not typicalof LVH with strain, and thechanges are more diffuse.

Figure 5

Figure 6
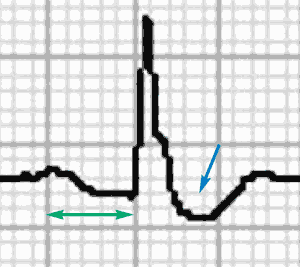
Bundle-branch blocks (C) characteristically feature downward-sloping ST-segment depression and T-waveinversion that is discordant to themajor QRS vector (Figure 6), yet bydefinition the QRS complex must exceed0.12 second to meet criteria for abundle-branch block. Thus, the ECGchanges seen in this patient are notconsistent with bundle-branch block.
Electrolyte abnormalities maycause ST-segment depression with orwithout T-wave inversion, as well asalterations in the QT interval, so theymust be considered as well. In additionto the ST-segment depression,the QT interval appears shortened inthis patient's ECG (see Figure 1).Hypokalemia (E) can cause ST-segmentdepression, T-wave inversion,and prominent U waves; however, theQT interval is usually lengthened inthis disorder. Hypocalcemia also classicallylengthens the QT intervalwhile leaving the ST segment and theT wave unaffected. Hypercalcemia(F) may shorten the QT interval, butit does not depress the ST segmentor alter the T wave. Thus, no electrolyteabnormality neatly explainsthe ECG changes seen here.
Digitalis effect (D) refers to aconstellation of ECG findings seen inpatients with therapeutic levels of thisdrug and is responsible for the ECGabnormalities in this patient. Althoughthe changes seen in digitaliseffect may persist if toxic levels areachieved, these changes are not to beconfused with those attributable tothe toxicity itself (eg, tachyarrhythmiasand bradyarrhythmias, ventricularectopy).

Figure 7
The classic change associatedwith digitalis effect is the concave,sagging, coved, or scooped STsegmentdepression seen best inthose leads with prominent R waves.At times, the J point (junction of theQRS complex and the ST segment)may be depressed. T-wave changesare usually asymmetric and variable;the T wave may be biphasic, inverted,flattened, or normal. Prominent Uwaves may occur, though usually notto the extent of those seen with hypokalemia.The QT interval may beshortened in digitalis effect, and thePR interval may be prolonged.5,6 Figure7, which shows a single complexfrom the tracing in Figure 1, demonstratesmany of the cardinal featuresof digitalis effect.
Outcome of this case. Results ofserial blood tests for cardiac enzymeswere negative, electrolyte levels werewithin normal limits, and the patient'sdigoxin level was nontoxic and withinthe therapeutic range--as it typicallyis when the ECG demonstrates digitaliseffect. The patient was admittedfor observation and frequent glucosemonitoring. Results of another ECGwere unchanged.
